eZanalytics is a tool designed to supplement Google Analytics and help organize the data based on an eCommerce site’s product taxonomy (breadcrumbs). eZanalytics consists of three distinct components.
eZQuery
See your eCommerce analytics data organized by product and category. Use this data to test and optimize the site for higher sales.
eZBrowse
Access to your Google Analytics while you browse your eCommerce site. Access to eCommerce analytics for every product and mouseover any breadcrumb to see total analytics for that category.
eZAlert
Easily monitor and track thousands of products by watching for significant key analytics changes as a means of identifying actionable competitive threats.
By now you should have already installed the eZanalytics chrome extension. If not, you might want to see the eZanalytics setup and configuration instructions. It’s also important to make sure that you’ve allowed the eZdia team to fully configure your account on its CrewMachine platform. CrewMachine is reached from the eZanalytics Chrome extension. It can take a few days to fully crawl the eCommerce site and establish the full Google Analytics connection. Once complete you should have received an email letting you know the process is complete.
In this manual we’ll step through each of the different parts of the product with step by step instructions on how to use this tool. But that doesn’t mean we’ve addressed every possible question. If for some reason this guide doesn’t answer your question, please contact us and we’ll do our best to quickly get your questions answered.
Getting Started with eZ Browse
Once the eZanalytics chrome extension has been installed, browse to your website and click on the icon at the top of the browser. Follow any log in instructions and you are ready to use eZanalytics.
1.1 Enabling & Disabling of the Chrome Extension
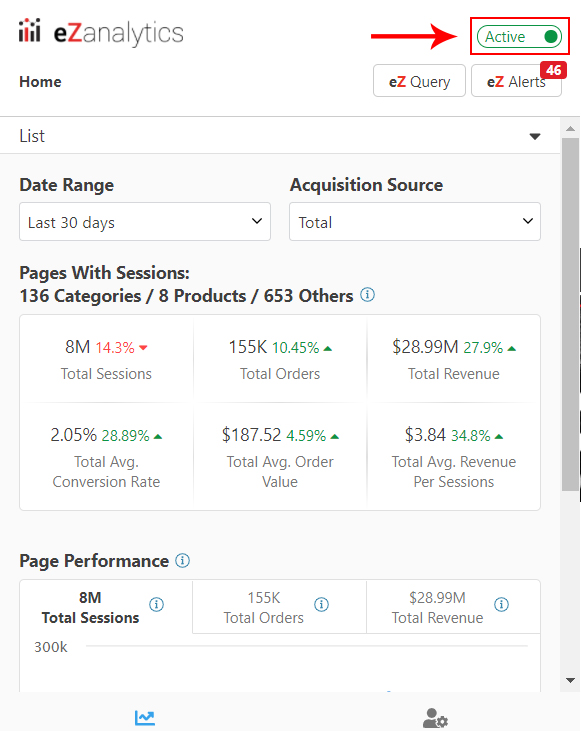
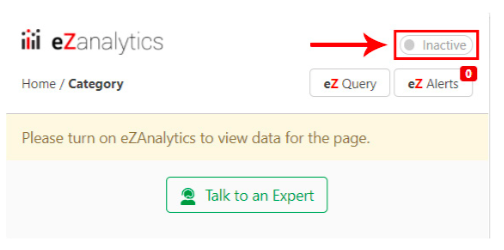
1. Click on the Chrome extension (as highlighted below) to toggle on the eZanalytics dashboard. This dashboard provides data specific to the page displayed. On the home page it should display site level statistics and as you drill down to the product-level the results become product specific.
1.2 Add to List/Tag Function
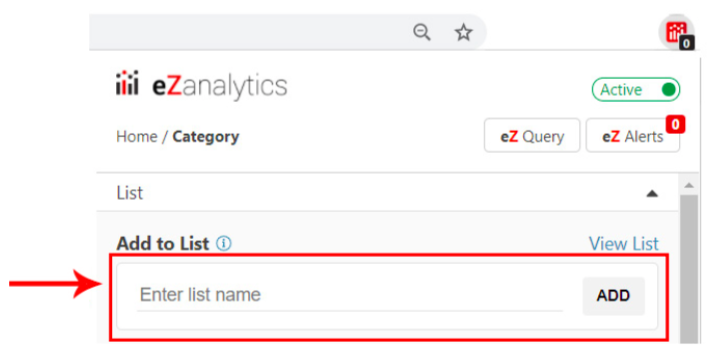
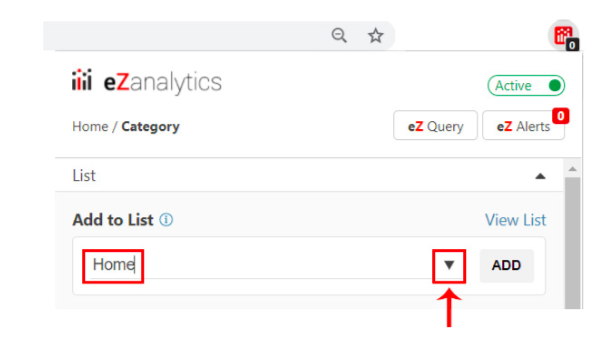
1. A list or tagging function is important if you want to track a group of products and monitor them as a whole. You might want to do a side-by-side comparison or simply compare the grouping to other categories on the site.
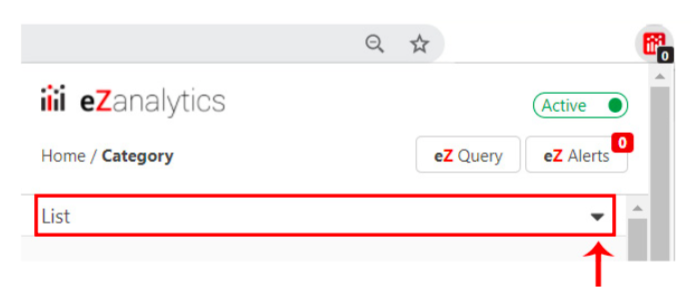
Open any page of your website in the browser & Click on eZanalytics Chrome Extensions the address bar and you will see the “List” section on the Chrome Extension as shown below.
1.3 Navigate through eZ Query
1. Open any page of your website in the Chrome browser & Click on eZanalytics Chrome Extension in the address bar and it will get open. In the Chrome Extension, you will see the “eZ Query” section as shown in the below screenshot.


1.4 Navigate through eZ Alerts
1. Open any page of your website in the Chrome browser & Click on eZanalytics Plugin in the address bar and it will get open. In the Chrome Extension, you will see the“eZ Alert” section as shown in the below screenshot.

2. Once you click on “eZ Alert”, it will take you to the Crewmachine where you will find all relevant details for which these alerts got triggered as shown below.
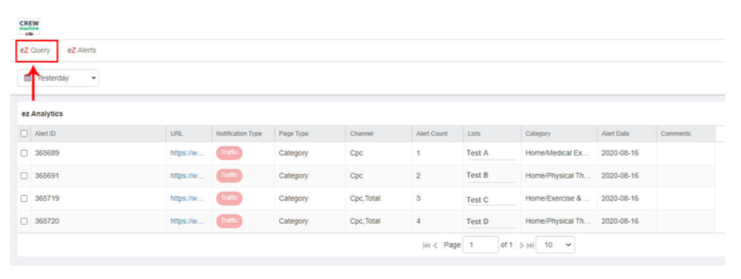
Note: If you open the eZanalytics Chrome Extension on the homepage, then it will show the total count of all three types that got triggered from throughout the website, while all other pages will show the count of alerts triggered for that particular page.
1.5 Pages with Sessions
Navigate through Different Acquisition Sources & Different Comparative Time Durations
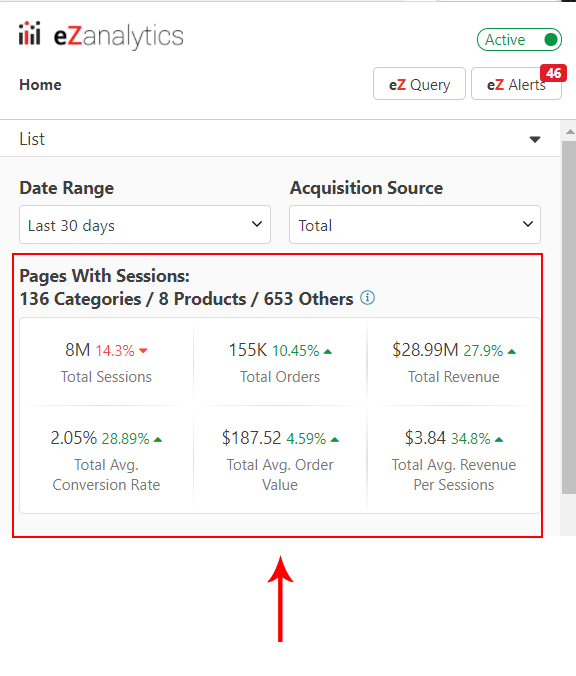
1. To see the Google Analytics data like Total Sessions, Total Orders, Total Revenue, etc for a particular page of your website, open the page in the Chrome browser & Click on eZanalytics Plugin in the address bar. In the Chrome Extension , you will see the “Pages With Sessions” section as shown in the below screenshot which will show Google Analytics Data Summary for that particular page.
2. To see Google Analytics Summary like Total Sessions, Orders, Revenue, etc across different acquisition sources for the page opened in step 1, use acquisition sources dropdown as shown below:
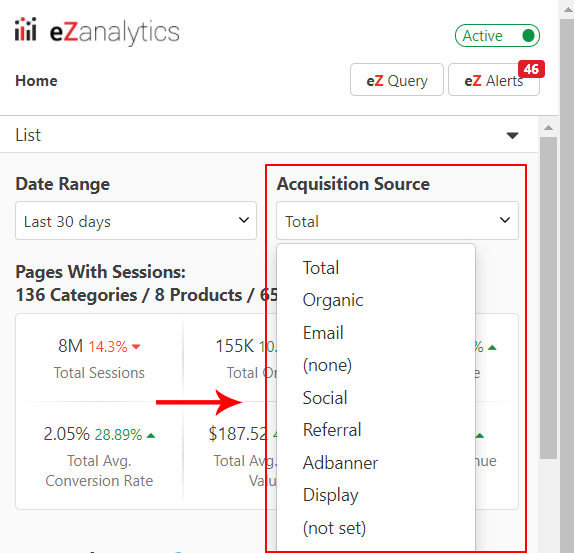
Note: The specific channels may vary based on how the Google Analytics account was set up.
3. To see the comparative data from a particular time frame (Last 30 days, Last 7 Days, Yesterday, Custom Date), use the “Date Range” dropdown as shown below.
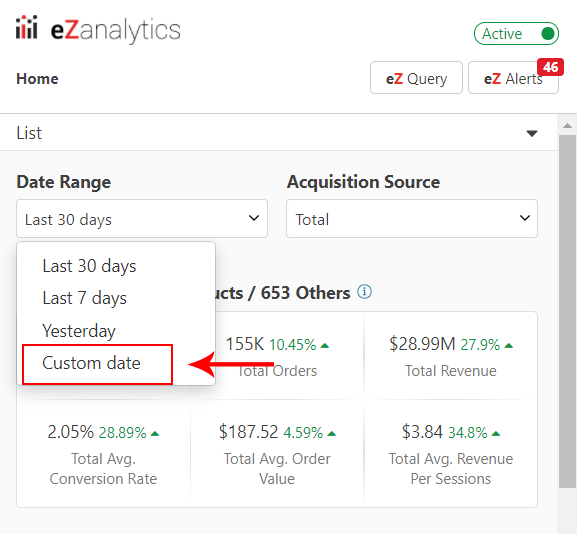
In order to see the comparative data for a particular date range, select the “Custom Date” option in the above screenshot and select the dates as shown below.
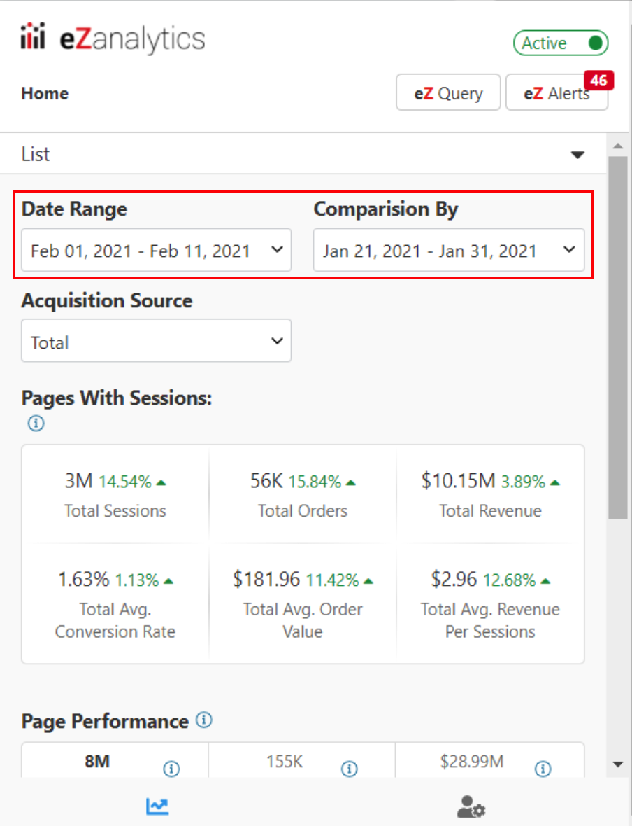
4. The numbers/arrow sign in Red & Green (in the above screenshot) shows the trending/comparison data and compares it to the previous duration. For example, if you select yesterday, it compares to the day before but if you select the Last 30 days it will compare to the previous 30 days. Red implies drop and Green implies Gain.
1.6 Mouse-over on the breadcrumb
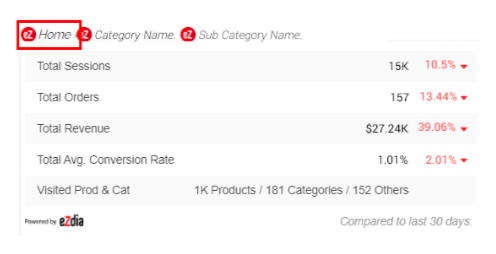
1. Open any page of your website which has a breadcrumb in chrome browser and you will see icon on the breadcrumb. Starting from left, when you bring the mouse cursor on the sign before “Home” as shown in the screenshot, it will provide the GA summary like Total Session, Total Orders, Total Revenue, etc for the complete website.
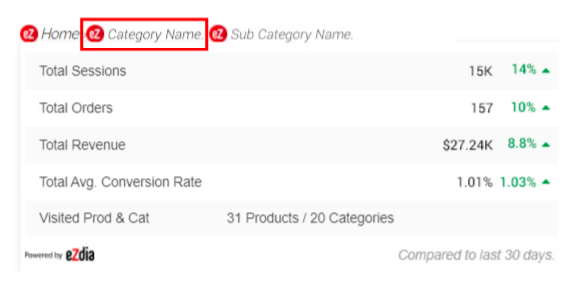
2. In continuation of the previous step, when we mouse over on the sign after “Home” i.e category page as shown in the below screenshot, then it will show the sum of the GA Summary parameters like Total Sessions, Total Orders, etc from all the individual product & category pages belonging to that main category page.
1.7 Page Performance Elements on eZanalytics Chrome Extension
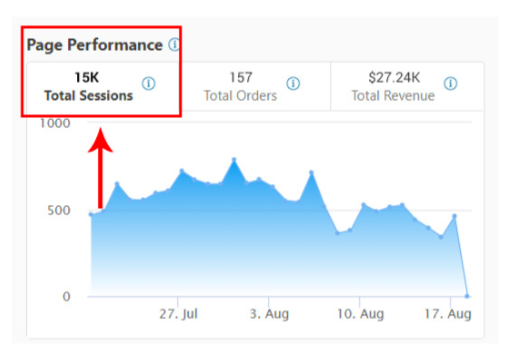
1. To see the last 30 days trend of Page Performance Elements (Total sessions, Total Orders & Total Revenue) from a particular page of your website graphical presentation, Open that page in the chrome browser, and click on the eZanalytics Chrome Extension in the address bar. In the Chrome Extension, you have to scroll down a little and you will see the “Page Performance” section and by default, it will show the Sessions trend as shown in the below screenshot.
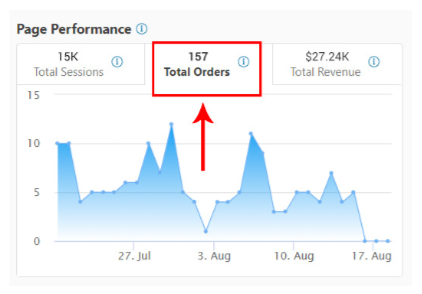
2. In order to see the Total Revenue/Total Orders trend, you need to click on the “Total Revenue/Total Orders” screen as shown in the screenshot below.
1.8 How to raise a support ticket?
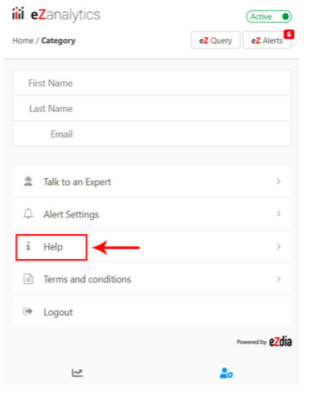
1. At the bottom left of eZ Browse, you will find an icon similar to this and when you click on it, it will take you to the Profile & Setting Page as shown below. In this page you will find an option for “Help” and once you click on it, it will take you to the support page, from where you will be able to raise a ticket.
1.9 How to Logout?
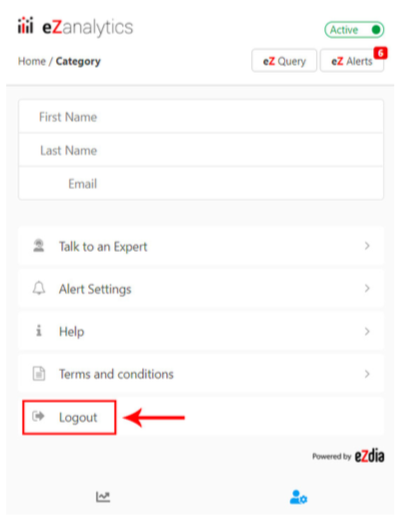
1. At the bottom left of eZ Browse, you will find an icon similar to this and when you click on it, it will take you to the Profile & Setting Page as shown below. In this page you will find an option for “Logout”.
2.1 eZ Query
eZ Query organizes key eCommerce Analytics data using the breadcrumb taxonomy on your site which makes it easy to analyze by Department, Category, and at the Product Level. Department and Category level data are the sum of all the product pages within. eZ Query makes it easy to filter, sift, and export your data at any level of granularity.
eZanalytics is designed around the eCommerce Big Six. The Big Six are the six metrics that provide a fundamental view for eCommerce sites. The first three data points are revenue, orders and sessions and the second three metrics are all ratios: conversion rate, average order value, and revenue per session. These six metrics together are fundamental to the eZanalytics design.
2.1.1 Category-Level Analytics
All data at the category level are a roll-up of the metrics by acquisition channel for all products in the category. Users can select category level data under page type as Product, Category, Home & Others from the drop-down list as shown below.
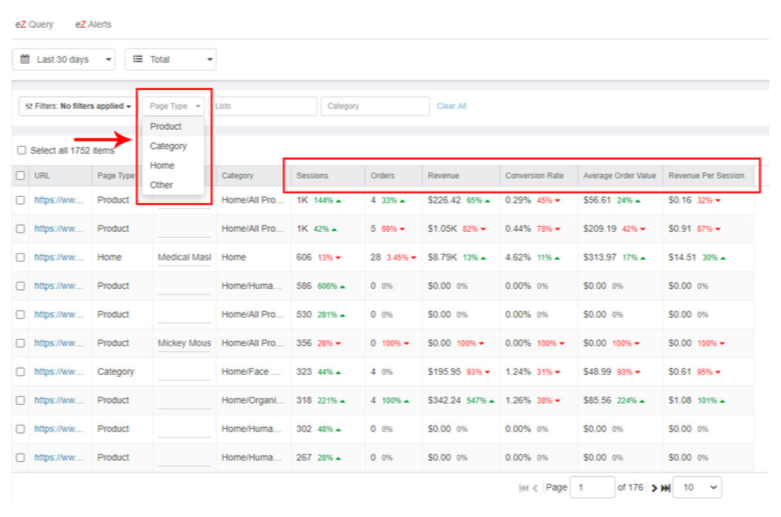
Sessions
A session is a group of user interactions with your website that take place within a given time frame.
Orders
Ecommerce data is composed of orders and item data. Order data is made up of the information collected about each order that occurs on your site.
Revenue
Revenue is the total amount of income generated from a website page.
Conversion Rate
Conversion rate is defined as the number of visitors to a website that completes a desired goal (a conversion) out of the total number of visitors.
Average Order Value
Average order value (AOV) tracks the average dollar amount spent each time a customer places an order on a website.
Revenue Per Session
Revenue Per Session is a measurement of the amount of money generated each time a customer visits your website.
2.1.2 Page-Level Analytics
Similar to Category Level Analysis, you can export the top 6 eCommerce analytics metrics by acquisition channel for comparative analysis. Users can select product level pages under page type drop-down list.
2.2 eZanalytics List
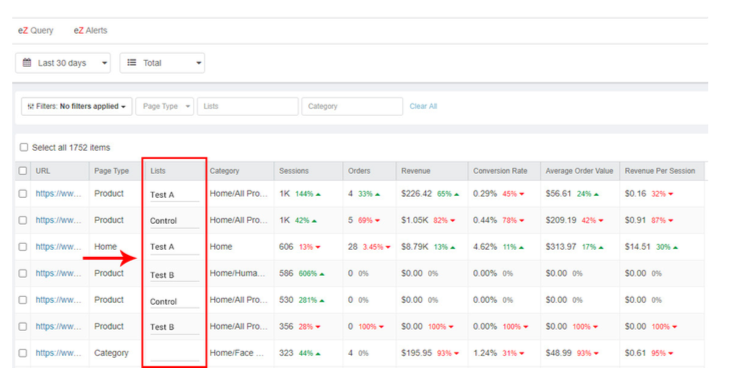
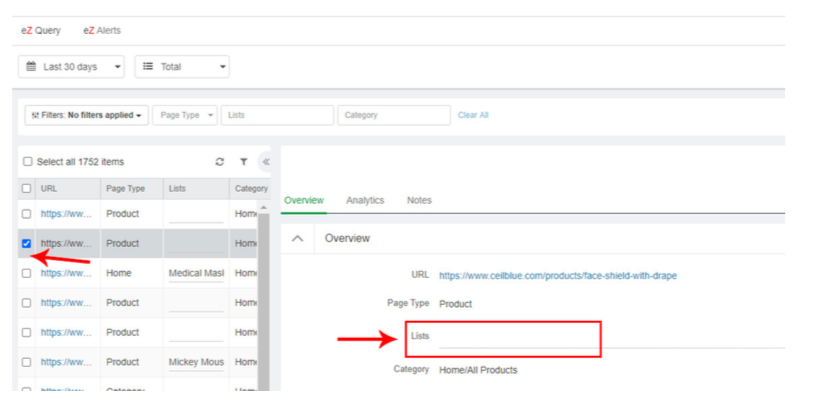
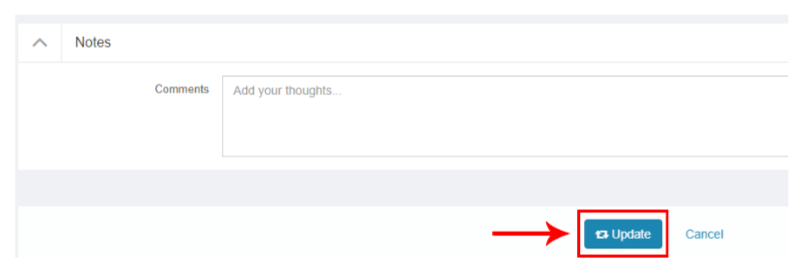
Easily organize any group of products or categories and provide both a Group Summary and a Product Drill Down.
1. Choose any page that you would like to add in a custom list. Click on any record from the eZ Query board as shown in the below screen.
2.3 Time Selection
Select Display Period to choose between yesterday, the last 7 days, the last 30 days or custom date. By definition, any comparison data uses the previous identical time selection. It helps the user to get more updates about your Query View. You can select the time period.
1. Click on the date range box.
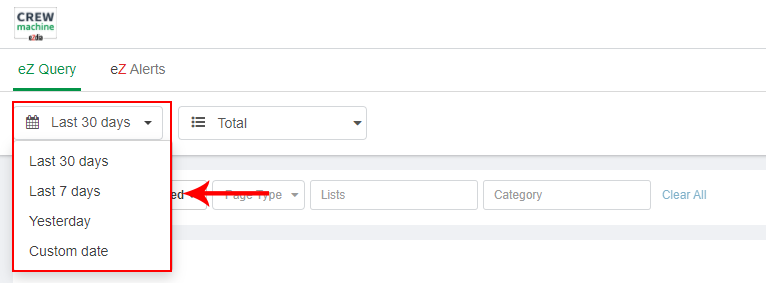
2. Select one of the options from the drop down like Yesterday, Last 7 Days or Last 30 Days or Custom Date as shown in the above screenshot.
2.4 Acquisition Channel
eZanalytics segments all page-level traffic by Acquisition Channel pulling those directly from the Client’s Google Analytics account and the specific channels can vary. Segmenting traffic is the process to explicitly see your different traffic sources.
By Traffic Type:
To see Google Analytics Summary like Total Sessions, Orders, Revenue, etc across different traffic channels like Organic, CPC, Referral, Email or Total, etc. for the page-level, use Traffic Dropdown as shown below:

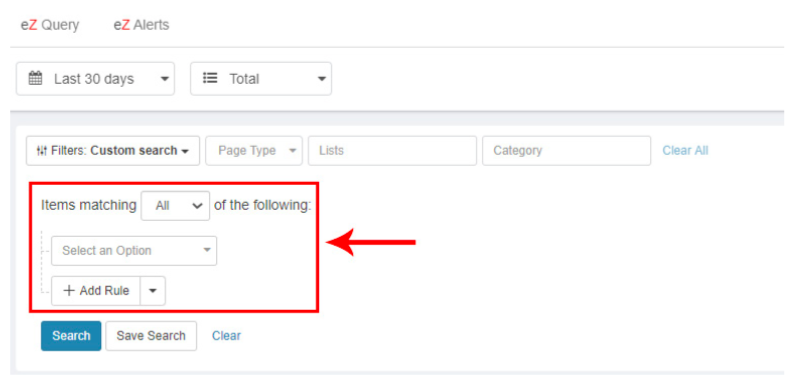
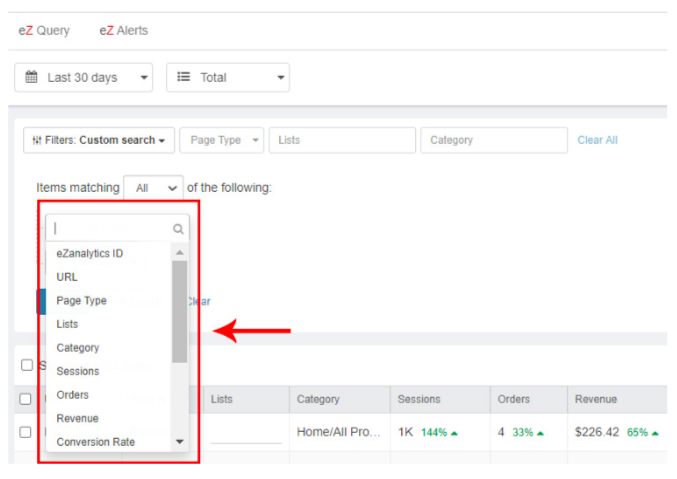
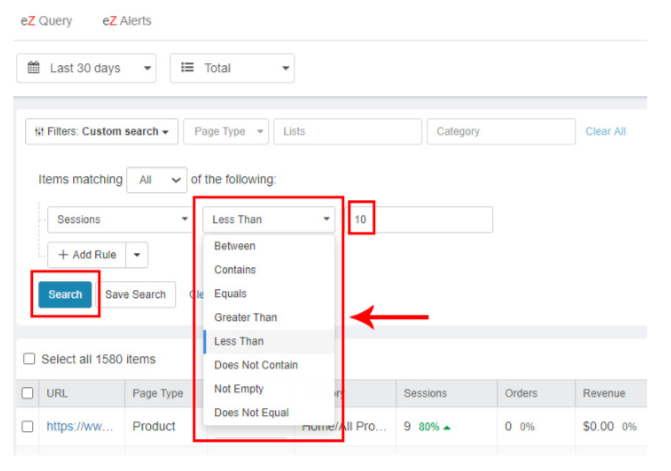
2.5 Custom Search
It helps the user to choose a search field based on specific requirements.
1. Click on the filters dropdown and you will find Custom Search Option.

2.6 Other Useful Options
2.6.1 Reload
It helps the user to refresh eZanalytics Query view data at any duration

2.6.2 Choose Column
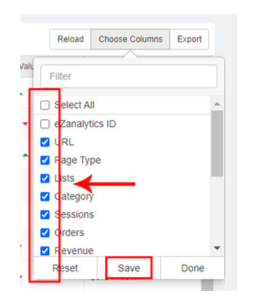
It helps the user to add or remove desired columns based on report requirements. Users can use ‘select all’ options to select all columns in a single click.
1. Click on the Choose Columns button.

2.6.3 Export
It helps the user to export data from the selected list of items. Select the items you would like to export and click on the Export button.

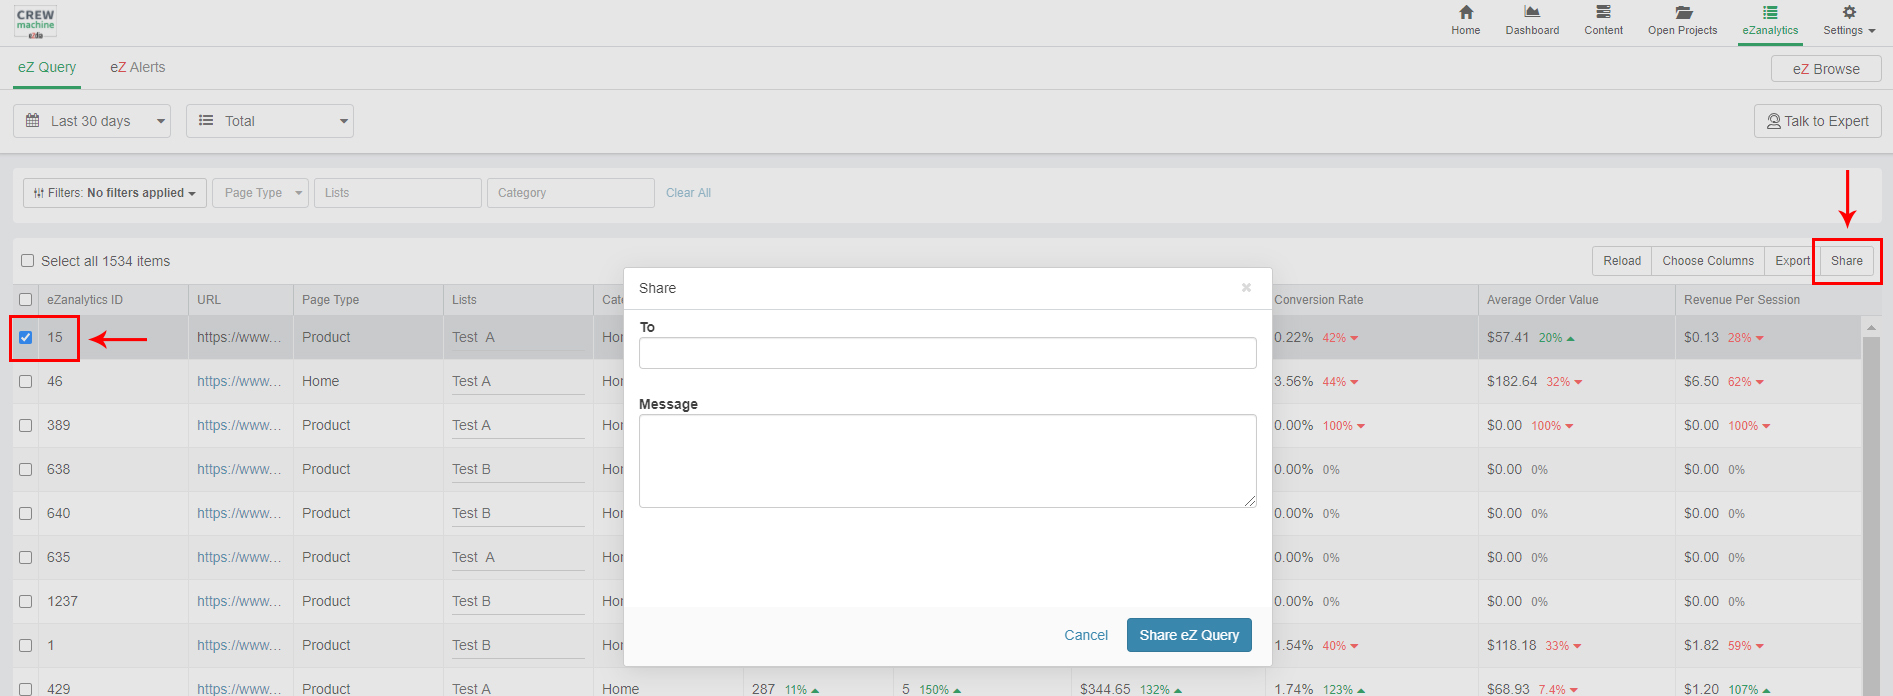
2.6.4 Share
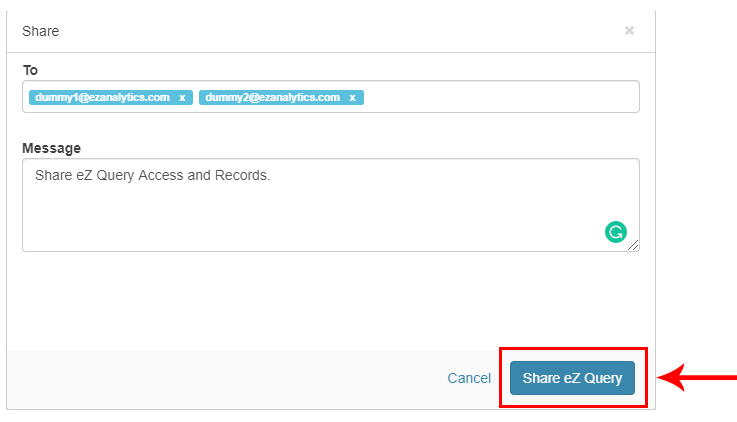
1. From eZ Query Dashboard, select any record and click on the Share button as shown below:
3.1 What are eZ Alerts?
An eZ Alert in eZanalytics is a custom-defined trigger that notifies you after a significant change in key metrics; sessions, orders, or conversion rate. And it can do this for any product or category.
The eZ Alert system is easy to use and configurable. You can set different kinds of alerts in eZanalytics to keep track of your eCommerce store pages like:
1. If conversion rate decreased or increased by x% for a product page or category.
2. If sessions decreased or increased by x% for a product page or category.
3. If transactions decreased or increased by x% for a product page or category.
4. If revenue decreased or increased by x% for a product page or category.
Alerts help you to make informed decisions based on the available information.
3.2 How to Access eZ Alerts in eZanalytics?
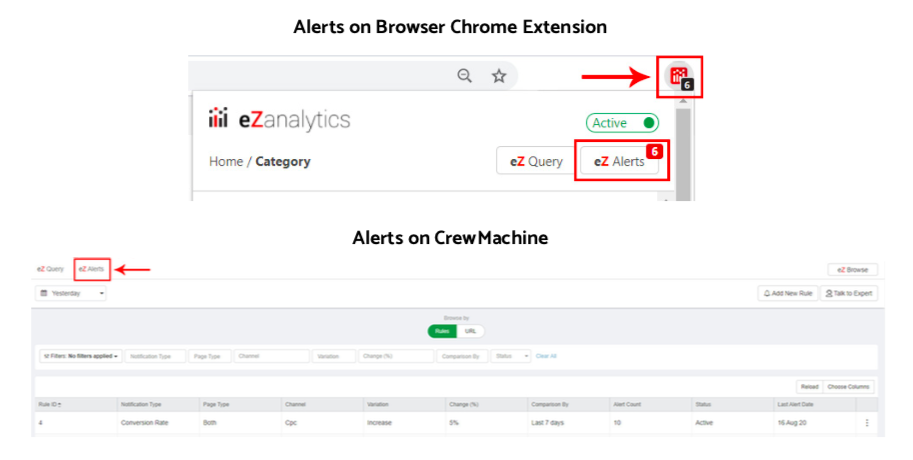
eZ Alerts can be accessed through browser Chrome Extension or directly accessed through eZanalytics on the CrewMachine platform.
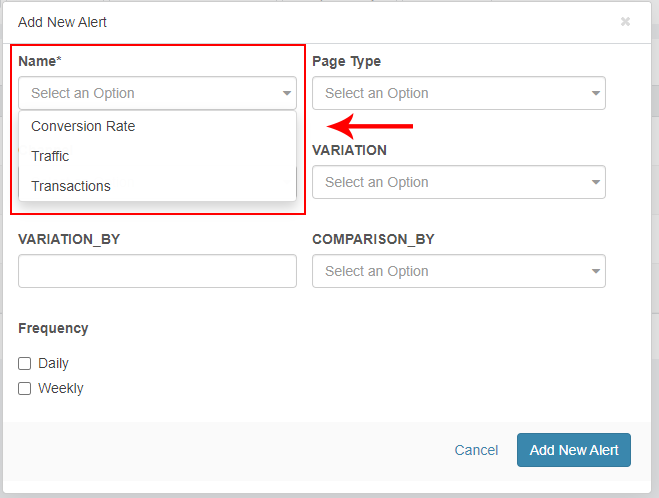
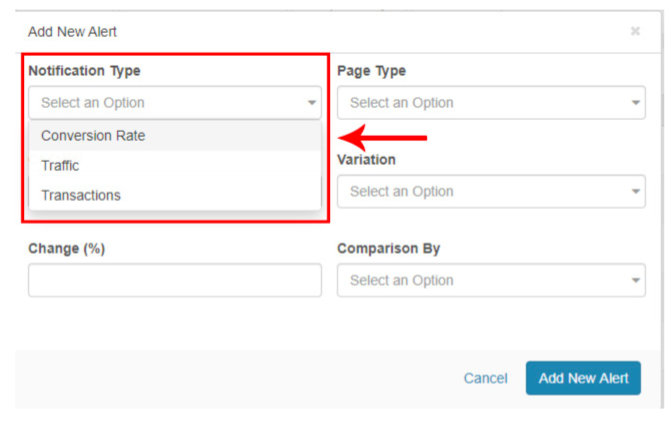
3.3 Types of Notifications
eZanalytics have three types of notifications including conversion, traffic and transactions.
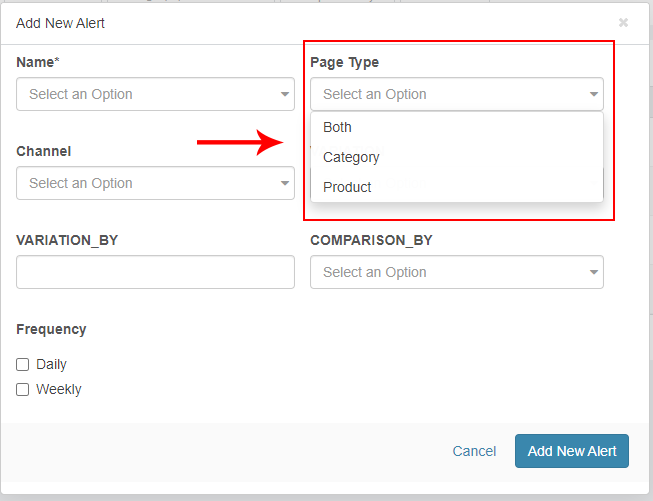
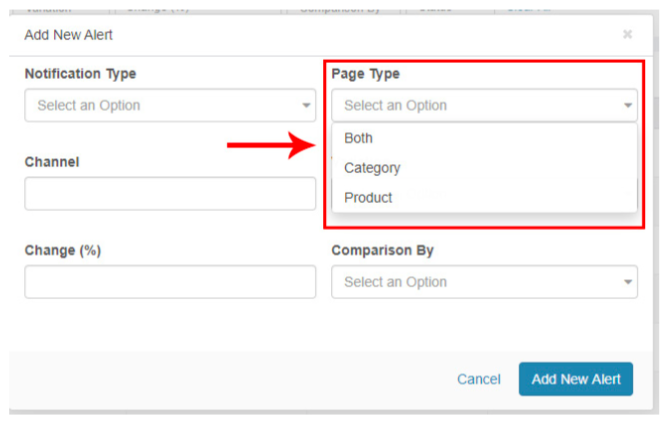
3.4 eZ Alerts by Page Type
eZ Alerts are designed to track product and category pages of an eCommerce website.
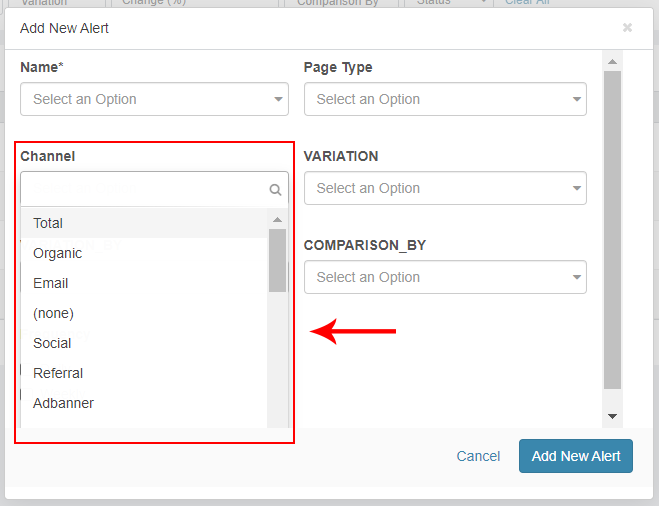
3.5 eZ Alerts by Traffic Channel
eZ alerts are designed to track all different sources of traffic like Organic, Paid, Email, Referral etc.
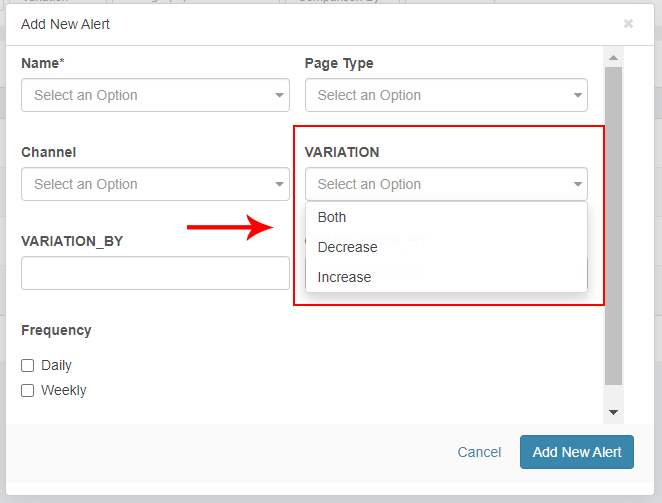
3.6 eZ Alerts Variation
eZ alerts have three variations which are used for setting up the alerts to track the increase or decrease or both of traffic, conversion, transactions.
3.7 eZ Alerts Time Period
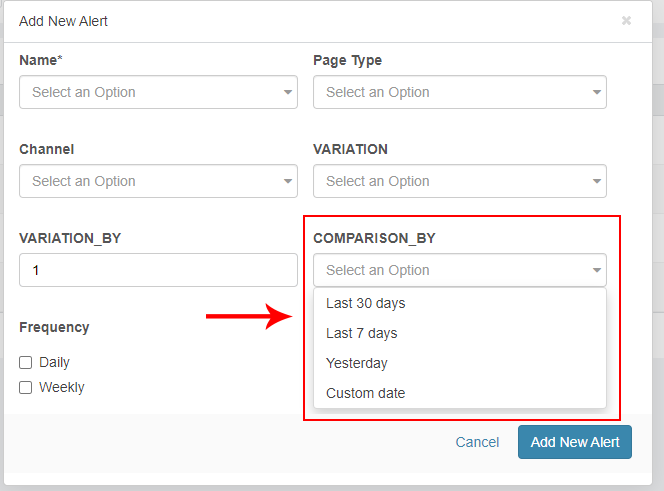
eZ alerts could be set for three different time periods like Last 30 Days, Last 7 Days and Yesterday.
3.8 eZ Alert ID
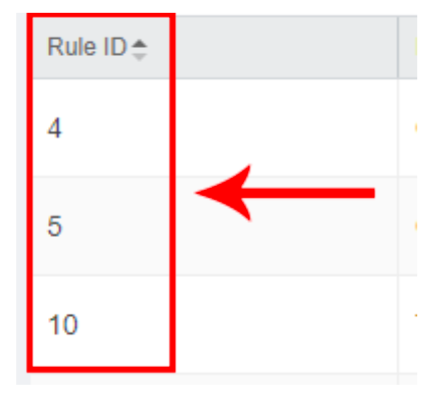
eZ alert ID is an alert identifier which uniquely identifies any specific alert in CM.
3.9 eZ Alerts Count
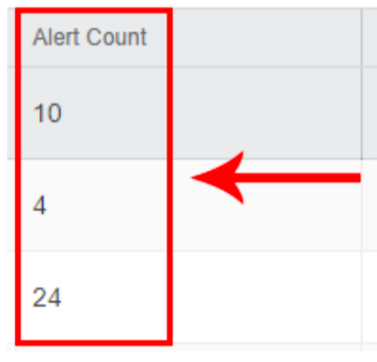
eZ alerts count is the number of times an alert has been triggered and recorded.
3.10 eZ Alert Date
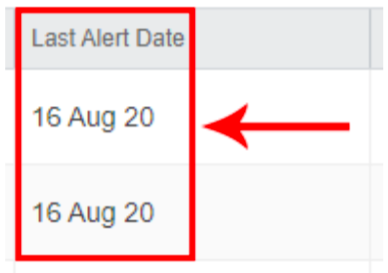
eZ alert date is the date when an alert gets triggered.
3.11 eZ Alert Status
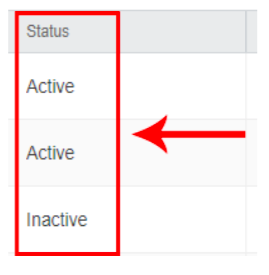
eZ alert status shows the condition of a particular page, if it’s Optimized or Not Optimized.
3.12 eZ Alert Setup Process
To set up an eZ alert in eZanalytics, please follow the following steps:
1. Click on the “Add New Rule” button in CrewMachine platform.

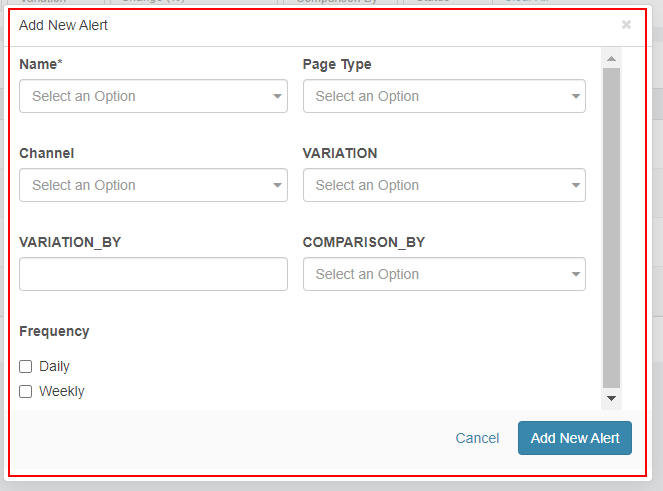
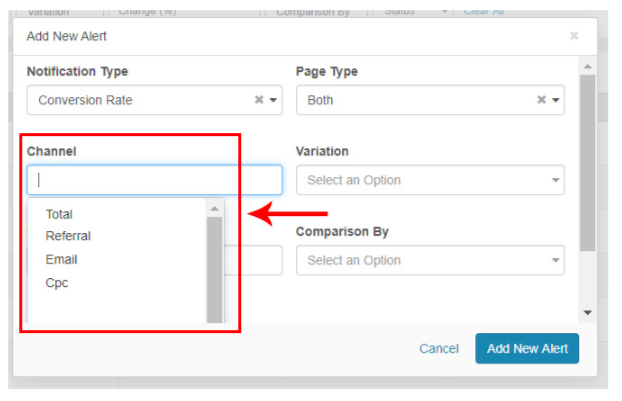
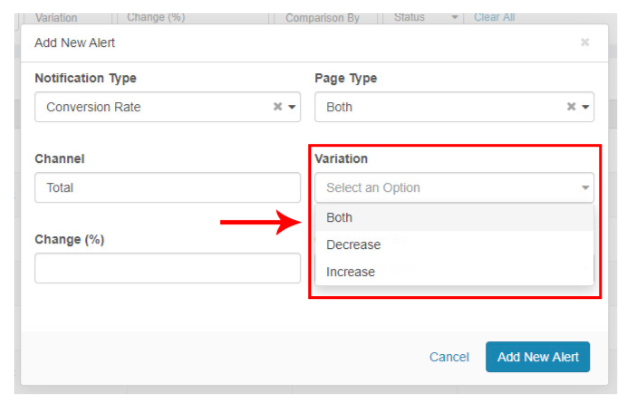
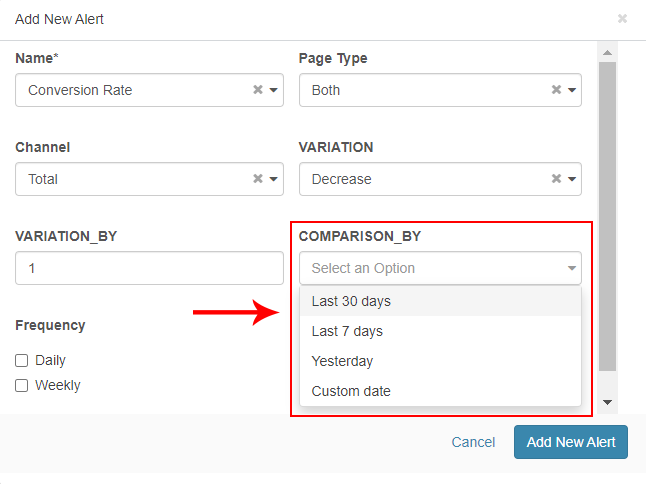
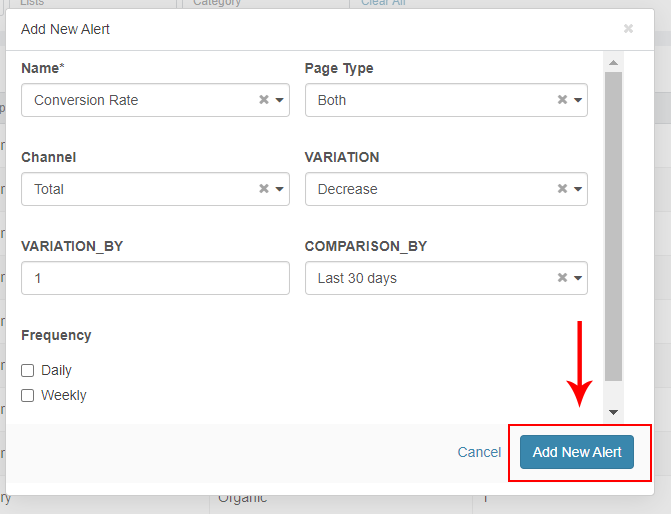
9. Select Alert frequency as Daily, Weekly, or Both by selecting the check box in front of Daily or Weekly as shown below:
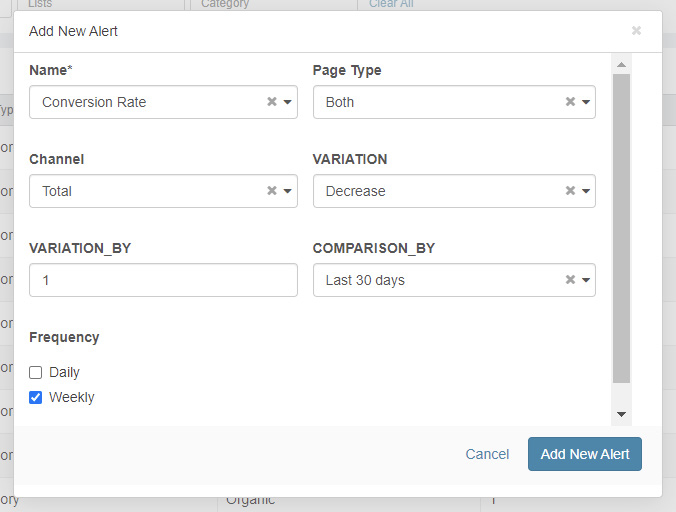
10. After providing all details, Click on the “Add New Alert” button to complete the alert setup and it will get added to the Alert Screen.
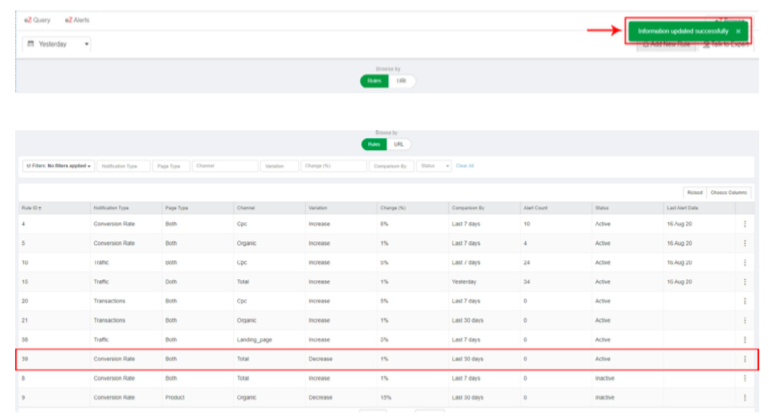
3.13 Edit an Existing eZ Alert
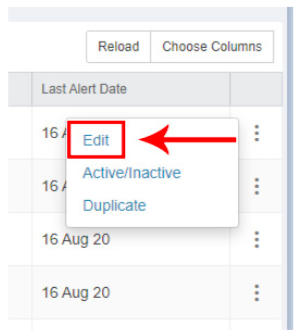
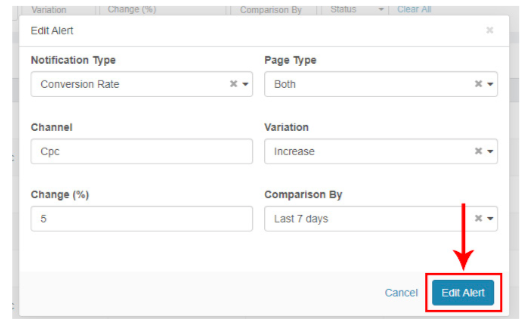
1. From the Alert Screen in CrewMachine, Click on three dots from last column of Alert table as shown below


3.14 Active/Inactive an eZ Alert
1. From the Alert Screen in Crewmachine, Click on three dots from last column of Alert table as shown below.

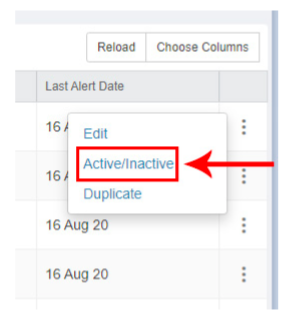

3.15 Duplicate an eZ Alert
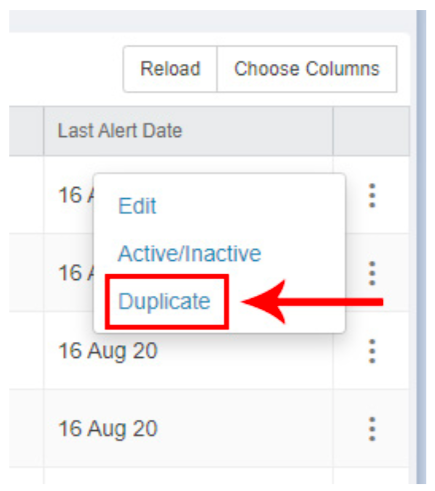
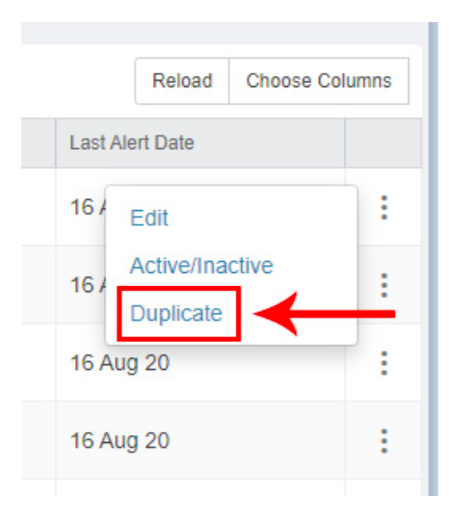
1. From the eZ alerts Screen in Crewmachine, Click on three dots from last column of Alert table as shown below.
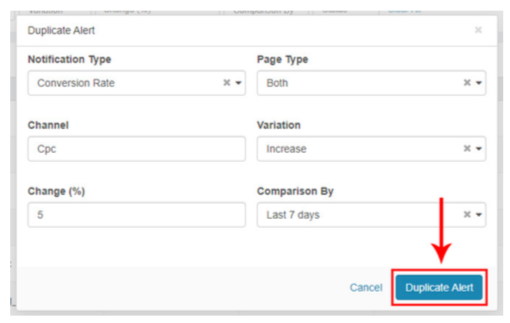
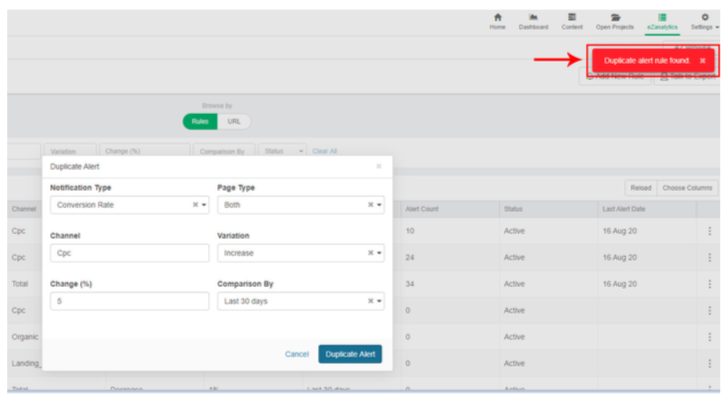
4. Make necessary updates and click on Duplicate Alert. Once you click on the Duplicate Alert and if it is unique, you will see the Information Saved Successfully else if a similar Alert is already present in the Alert System, you will get an error message as “Duplicate Alert Rule Found” and it wont allow you to Duplicate as shown below:
3.16 Browse By URL
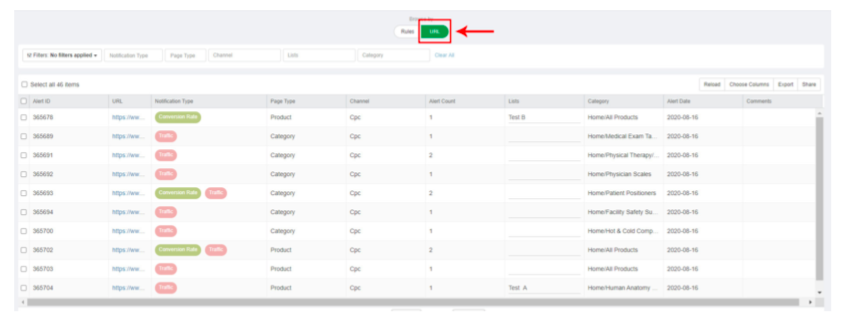
This feature enables you to see URLs for which all alerts got triggered and other relevant information related to those URLs & Alerts as shown below
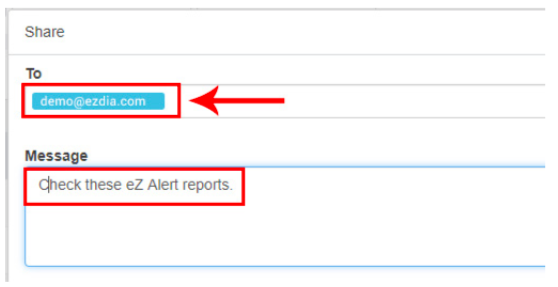
3.17 Share eZ Alerts Report
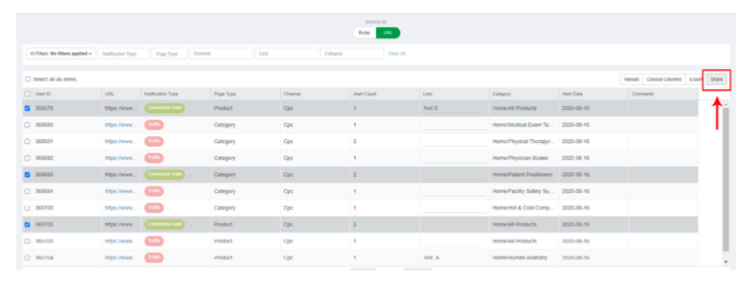
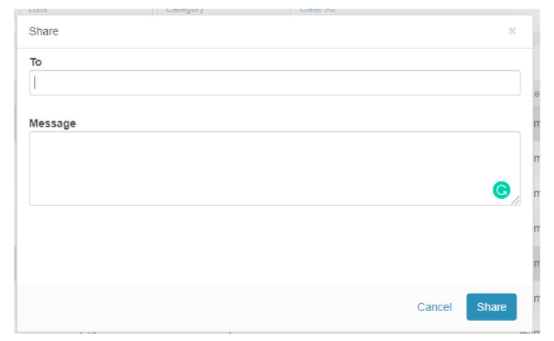
1. Go to “Browse By URL” section and select the eZ alert reports that you would like to share as shown below.
3.18 How to act on different notifications
Based on the eZanalytics notification type, you could optimize the low-performing eCommerce pages. Below are the details:
If Conversion Rate Has Dropped
Conversion rate is usually associated with page quality. So, having a well structured web page, helps in improving the conversion rate. The key elements to check are:
• Detailed product copy including the key features and attributes.
• Good product images and videos
• Product FAQs
• Free shipping and specials offers
• Good shopping cart experience
• Show contact info and offer live chat
• Good site filters
• Product reviews
• Clear, big calls to action etc.
Optimizing the above elements of an eCommerce page facing conversion rate drop will help to recover and improve the performance.
If session has dropped
There could be different prospect of session drop like:
• Is the decline a sharp, sudden drop-off, or a slow and steady decline?
• Did the traffic only dip for a few days?
• Does it look like the traffic is beginning to recover on its own?
if the drop was sharp, sudden, and isn’t recovering then the website could be suffering from a Google penalty. However, if the dip only lasts a few days and looks like it’s recovering on its own, the website may have just had connectivity issues that were fixed over a few days.
To improve the performance of an eCommerce page facing sessions drop issue, you should analyze the following:
• Check out the Google algorithm changes
• Check out the search console for any penalty
• Check out the backlinks losses
• Check out the targeted keyword’s ranking trend. Lower search rankings that in turn lead to traffic drops.
• Fix Page Redesign/Updates Issues
• Fix Technical SEO Issues
• Fix Low Quality Content. Google punishes low-quality content and rewards
high-quality content.
• Fix the Meta Title and Description to improve the CTR.
•
If transaction/order has dropped
Decrease in transaction is the most critical metric to observe and fix. You should consider the following to improve the conversions on an eCommerce page:
• Re-analyse your landing page experience.
• Improve the shopping cart experience of users.
• If the account creation process takes too long or there’s an issue on the
payment page, we should fix it.
• Send a pop-up or email notification to website visitors, offering a discount.
• Optimizing or simplifying the checkout process.
• Make the page more user friendly via adding the conversion content on the
product page including the enhanced product images/videos, description, specifications, attributes, faqs, etc.
